Author: history396breault

Quantitative History and “Migration in the 1930s: Beyond the Dust Bowl”


Since I will be missing from this week’s lecture I wanted to discuss this week’s topic of Quantitative History and Historical Databases. Quantitative history is a discipline of history that uses various skills and methods to analyze statistical data. We explored this topic by reading “Migration in the 1930s: Beyond the Dust Bowl.” In this paper, the authors sought to look at migration in the 1930s and 1940s using the statistical data from the 1940 US Census of Population, which had asked all inhabitants where they lived five years previously. The authors sought to dissuade their audience of the traditional view that out-migration only occurred in the Dust Bowl region. Instead, the authors looked at all of the counties between 1935 and looked at the economic and environmental pressures that might have caused a family to migrate. (Figure 1)


The first element that was looked at was total annual precipitation and average daily temperature. What is most notable about the maps made from these statistics was that the area most impacted by extreme heat or lack of rain was not just the area described as the Dust Bowl but the entire Midwest stretching from Saskatchewan all the way to Texas. (Figures 3 and 4)


The second element that was examined was agriculture. By taking data from censuses of agriculture at the time the team was able to see how crop failures may have impacted movement.Again, the map demonstrates that the affected area was not limited to the Dust Bowl even if it was one of the most impacted areas. (Figure 5)


The third factor that was explored as an option for out-migration was unemployment. This factor does not easily line up with the previous two as the highest rates of unemployment are concentrated in the Deep South, Utah and New Mexico, the Appalachia and the North. (Figure 8)


The project was able to demonstrate using quantitative data and maps that the out-migration typically associated with the Dust Bowl was actually a larger trend impacted by weather, agriculture, and unemployment that drastically impacted the Midwest from Saskatchewan to Texas.

MALLET as a Digital Tool

I chose MALLET to analyze as my digital tool because I was intrigued by how it can be used to find patterns and relationships in large databases of text using programming. Another reason that I chose to look at MALLET is that I plan to use text mining for my final project and I thought it would be beneficial to get an early start in learning more about the digitals that I will most likely be using in the coming months. In analyzing MALLET as a digital tool I had three questions in mind.

The first question I asked myself is what is MALLET? The Programming Historian Website describes MALLET as a digital text mining tool part of a process known as topic modeling that uses Java elements on text to process natural language, cluster, and classify documents. Topic models do not look at the meaning of the words in a document. Instead, the program extracts a word like a topic, where the computer sees a topic as a part of a list of words that interact in statistical ways. To explore further what is meant by a topic you can look at Mining the Dispatch’s Topic page, where Robert Nelson explains thirty-seven of the forty topics that he modeled for his digital project including slavery, soldiers, and politics.

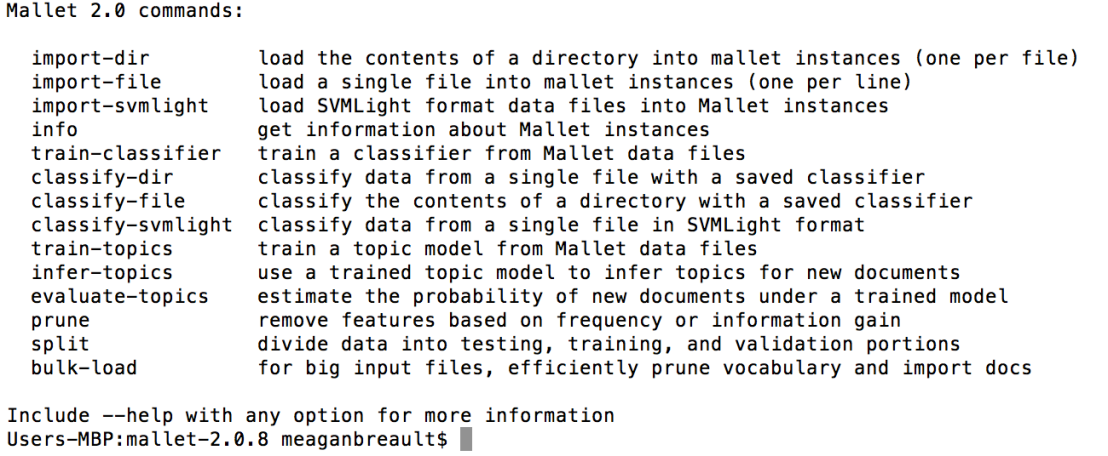
MALLET itself has fourteen commands that allow its user to decide what they wish to find or sort out of a text. The image below is the list of commands that MALLET uses.
mallet-commands

The second question I asked myself is what makes MALLET different from other text mining tools? When I was first looking into the idea of examining a large corpus of textual documents, I was unsure of the difference between all of the text mining tools such as Voyant and MALLET. I found that Voyant, where you simply insert the text you want to read, was too simple because you could not code the elements that you want the program to find. If I had been looking at a single document or a few documents it might have been sufficient, however, I plan to look at hundreds of documents.

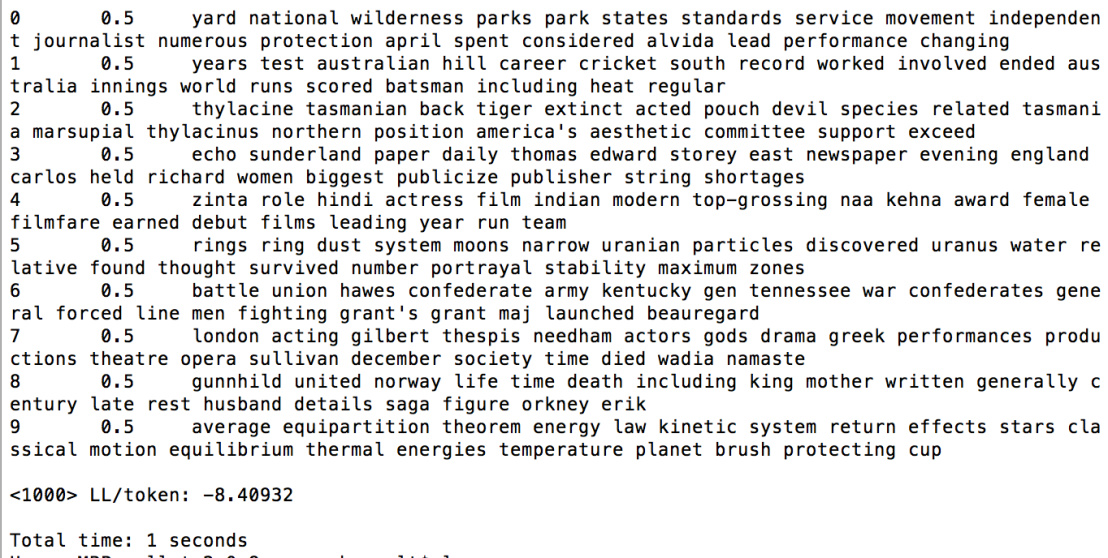
MALLET is the perfect program for a history student who wants to examine hundreds or thousands of documents but does not have the time to read and analyze each and every document themselves. That is why I chose to MALLET, which has the capacity to search through large amounts of data in a relatively short period of time.  For example, when I was completed the “Your first topic model” tutorial on the Programming Historian website, the program was able to find key words that help statistically define the importance of a topic and place the words that had the same outcome together all in just 1 second!
time

The final question I asked myself is how user-friendly is MALLET? My first experience with the program was through the Programming Historian website. Programming Historian has tutorials for Mac or Windows users written by top digital humanities and digital history experts Shawn Graham, Scott Weingart, and Ian Milligan. The tutorials are designed for intermediate digital users and do require some prior knowledge of command line. For more practice with command line click here.

I did have quite a bit of trouble getting started as I could get the program to tell me that I had a directory but when I tried to perform any of the commands I would get an error message saying “no such file or directory.” After a little help from Professor Clifford, I discovered that I had to find the exact location of the MALLET directory on my computer before continuing.
Another issue, I had with the program was that I was attempting the program using my Mac laptop and the structure of a command is different for a Mac compared to a Windows computer. For example to give commands for MALLET on a Mac the user has to reverse the direction of the slashes. So that means for Windows the command would be typed as \bin\mallet but a Mac would be ./bin/mallet. While Programming Historian did have a section on how to download MALLET on a Mac, many of their instructions for how to perform different commands were written for Windows users, which was confusing for Mac user.

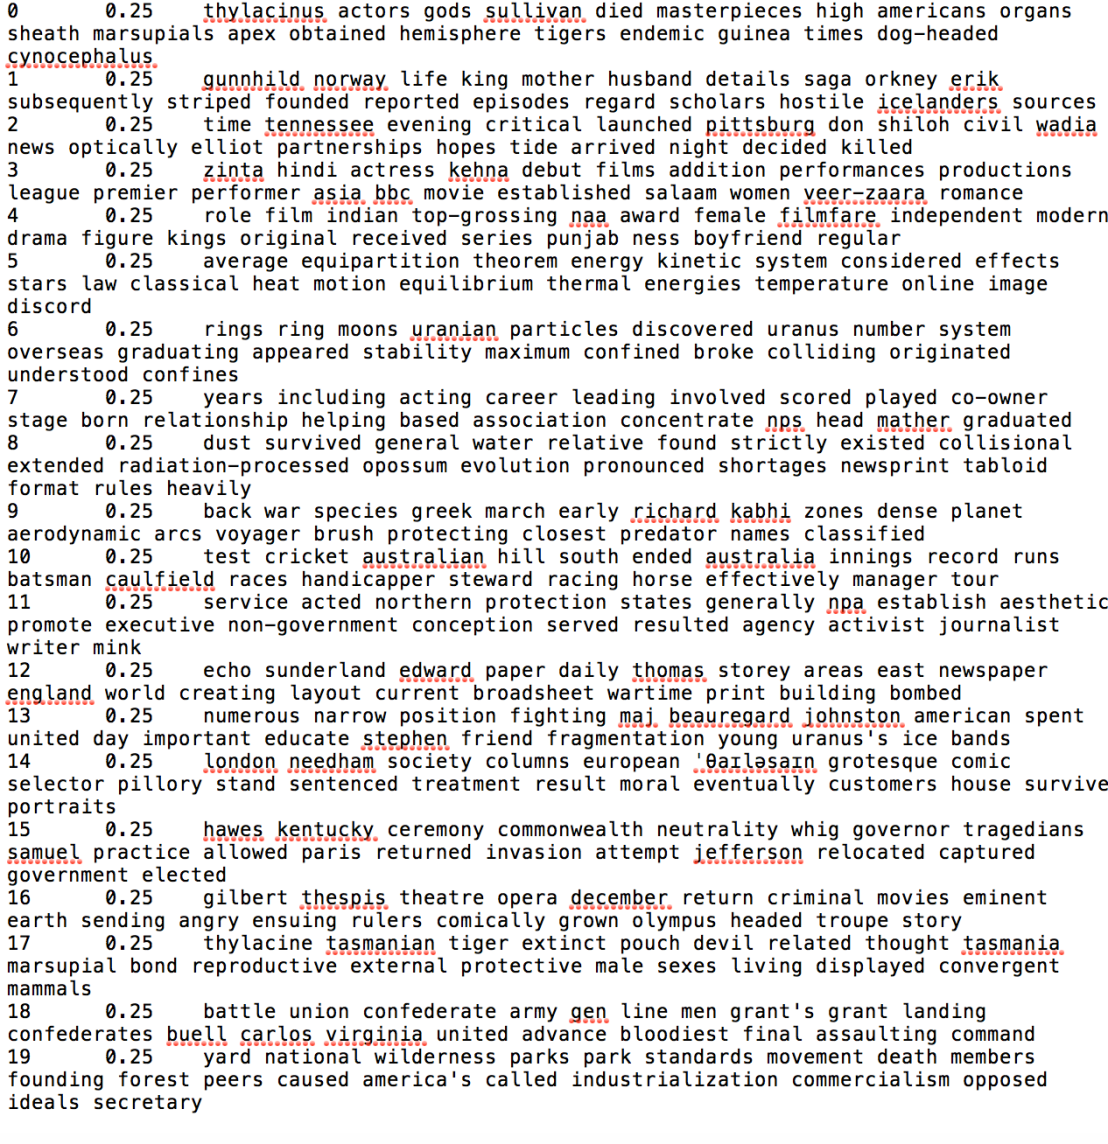
Eventually, I was able to get the program working and then it was really interesting to see how MALLET could be commanded to find the types of information in a corpus of documents. As I mentioned earlier, I was able to complete the “Your first topic model” tutorial in which I told MALLET to open my tutorial.mallet file, find twenty topics, put every word from my documents into a topic, save it in a zipped file, save a text file with the top words for each topic, and save it as a text file.
text-file-example
The image above is the text file that I was able to create using MALLET and the tutorial data. The first number shown is the number of the topic created.  The second number indicates the weight of that topic. And then the key words that MALLET found statistically important for each topic are listed after.

If you are interested Robert Nelson’s Mining the Dispatch is an excellent example of how MALLET and topic modeling can be used to create a final product. Visitors to Nelson’s site can explore the wide array of results that MALLET can be used to create such as graphs, topics, and timelines.

MALLET is definitely a more difficult tool to learn at the start but once the user becomes more comfortable and begins to understand the patterns and commands that the program allows, the task becomes much easier. To complete the tutorials or learn more about topic modeling and MALLET click here.

100 Years In Flanders Fields

I chose to work on the 100 Years of In Flanders Fields digital project because I recently took a class on the history of the First World War. I was interested in learning how digital methods could be applied to aspects of the First World War.

The 100 Years of In Flanders Fields project was established by Guelph Museums in honour of former Guelph resident, soldier, doctor, and poet John McCrae. The project was created using the ArcGIS program called Story Maps, which allows the creator to combine maps with images, videos, and a narrative text to convey a story. In this case, that story is the life and legacy of John McCrae and his famous poem In Flanders Fields.

Given that the Story map was created by Guelph Museums, the purpose of this digital project is to engage the public in the story of a celebrated war hero and poet. The project was launched around the 100th anniversary of the writing of John McCrae’s poem In Flanders Fields in 2015. By launching the website during the poem’s one-hundredth anniversary, the museum is able to gain more of the public’s interest, especially since In Flanders Fields is one of the most celebrated poems of the First World War not only in Canada but abroad. By using the Story Maps application the museum was able to make a simple and easy visual aid to remind citizens of both Canada and the world who John McCrae was, why he wrote In Flanders Fields, and how the poem has created a legacy. This digital history project is supposed to be a celebratory history of a brave Canadian that is meant to educate and get the public interested in their past.

The site allows its visitors to scroll through twenty-four sections that explain the life of John McCrae while looking at pictures and maps that mark important locations in his life with a poppy. For example, on the first slide entitled “Early Years” visitors can click on the poppy on the map and an information bubble pops up informing us that that house was the McCrae’s birthplace and the house he grew up in.

The fact that project is only twenty-four sections is a limitation, however, as it restricts the amount of information that is being conveyed to the public. Each section on John McCrae’s life is very short with only a few sentences. For example, there are only two sentences on how McCrae’s poem has created a lasting legacy. They only explain how the poppy was adopted as a Flower of Remembrance for the war dead in Britain, France, the United States, Canada and other Commonwealth countries but the project does not explain how the poem became popular in the first place and why it has remained so popular over the last century. The project probably could have added a little bit more information to each section. The site creators were most likely trying to “chunk” or reduce the information to keep the visitor from getting confused or bored but in doing that the people reading the project are only getting a small glimpse into each part of McCrae’s life. (For more information on chunking please visit here to see Daniel J Cohen and Ray Rosenzweig’s explanation).

With that being said, the project does an excellent job of providing information about John McCrae’s life that most people would not know. In school, most Canadians would have at least heard the poem In Flanders Fields at a Remembrance Day ceremony. And maybe they learned that McCrae was a physician who volunteered during the First World War, and wrote his famous poem after the death of a fellow comrade before passing away of pneumonia in January 1918. Yet very few people have any knowledge of John McCrae prior to his enlistment in the First World War.

What most people do not know (including me before I explored this site!) is that the First World War was not the first war that McCrae fought in. When the Boer War broke out in October 1899 McCrae postponed his fellowship at McGill University in order to volunteer. It was here that he first experienced the mixed emotions of war. He believed in fighting for his country but was saddened by the treatment of the sick and wounded soldiers and animals.

The site also demonstrates that McCrae was an avid traveller and outdoorsman. In 1910, he canoed from Norway House in Manitoba to the Hudson’s Bay with the Governor General, which took a little over a month. That same year he took a steamship that travelled to Labrador, Newfoundland, Prince Edward Island and Quebec City. He had an adventurous spirit and was eager to explore our country of Canada. The project shows that John McCrae was not only a soldier but also a physician, outdoorsman, traveller, artist, poet, and more, which is important for understanding what led John McCrae to become the man who volunteered to serve his country and write the poem In Flanders Fields.

One interesting aspect of the website that is not related directly to John McCrae’s life is the last page called “Guest Book.” Here guests can follow a link to submit the location of their city and a Poppy will appear on the websites Guest Book Map. The poppies on the map represent all of the locations across the world in which the website had been accessed and someone has requested that their city be added to the map. The Guest Book is a very unique way of making the website more personal for each visitor, making them feel a part of the experience. Surprisingly, Saskatoon was not yet on the map so I took it upon myself to submit my location to add Saskatoon to the map! And you too can to add your location to the growing map by clicking here.

Despite the limitations in the amount of information displayed, overall the 100 Years of In Flanders Fields project is an excellent way to learn about one of Canada’s most celebrated men and I encourage my fellow students to explore the site.
Creating a Timeline

I chose to try to make a timeline today because timelines are an easy visual aid for learning history and I wanted to explore how simple it would be to make one.

I chose to look at the Alberta Eugenics Board.

Visit here to see the timeline I created!

After just over an hour I was able to come up with a fairly simple looking timeline. The main issue that I came across was that my topic did not have a lot of images that were readily available on Wikipedia or Flickr Commons so my timeline is fairly plain looking. Overall though I think that learning to make a timeline is a useful skill.